

Non- Oxygen Conventional Gases Permeability Analysis
Source:
Viewer:3370
Issuing Date:2008-10-30
Click to download!
Abstract:This article will introduce the test method of non-oxygen conventional gases permeability. It will also discuss the accuracy and the rationality of the test by theoretic analysis and practical test.
Keywords:
gas permeability
, gas transmission rate
, gtr
, film
Packaging can take place in a variety of forms. Oxygen and water vapor are not the only causal factors which could lead to the deterioration of products. As MAP packaging and CAP packaging are becoming popular, the permeability of those gases, which were not usually concerned (including some of the inert gases), is being more noticeable. Oxygen and water vapor barrier testing are very popular. But how is the permeability testing of nitrogen, carbon dioxide, air, and other common gases? Is the actual method accurate? In this paper these issues will be discussed.
1.Conventional Methods to Collect Data
For non- oxygen conventional gas permeability test, data collection methods has been a focus of concern. One approach is to be directly tested by equipment. So far only differential pressure method testing equipment is able to test the barrier properties of certain materials to a wide range of gases (He, N2, Air, O2, CO2, etc.). If the user can control the air input well and deal with the exhaust gases properly (especially for flammable, explosive, toxic gases), then such device can also be used to test some of the special gases. Comparing with the oxygen test, the replacement of the test gas will not increase the cost of test, and test process is the same with the oxygen test. Equal pressure method equipment can not be used for general-purpose gases barrier property test. It is determined by its test principle. Another method is to obtain results by estimation. In the past few can be used to test non-oxygen conventional gases. In order to obtain the permeability of these gases, sometimes it is estimated by using a specific proportion of oxygen. Such estimation proportion are mostly the data from technology literature (the estimates itself is not one determined value due to that the technological documentation often refers to different estimates of the ratio). Furthermore the estimation proportion barely changes with sample materials and test environment factors. In practice, however, the above two data collection methods do not share a good consistency. There is no doubt that the directly measured data are valid and reliable. Then what caused the significant deviation in the data? Could it be rectified? I will share my theoretical analysis and experimental validation in the following sections.
2.Theoretical Analysis
There are 3 factors influencing the permeability of polymer films. They are polymer structure, gas permeability characteristics and environmental aspects. In this study, the main focus is the influence of the gas permeability characteristics, including the gas molecules size, shape, polarity and the cohesion strength and so on. The environmental aspects and the polymer structure will only be mentioned when necessary.
The molecule shape and size will influence the gas proliferation inside materials. The molecule size can be expressed by the dynamics diameter of the molecule. The smaller the diameter is, the easier it is to spread in the polymer and the greater the diffusion coefficient is. But to the diffusion gases with comparable molecule weight and different shape, long strip molecules own the strongest permeability.
The molecule polarity and cohesion ability are the main factors affecting gas solubility on the material surface. As polymer materials have different polarity, the changes of solubility index became the most important factor influencing the permeability of gases.
If the polymer does not have functional group which could interact with gases, the critical temperature is the key to control the solubility. Often, the higher the polymer critical temperature is the greater the solubility is. Of course, the solubility of gases in the polymer usually follows ‘the more similar they are, the easier they dissolve together’. If some chemical structure (which could greatly dissolve certain gas) exists in the polymer, the selective permeability of this polymer against certain gas could be greatly increased. Also because of the solubility factors, when comparing gases permeability against certain polymer material, some big diameter molecule could have great permeability index.
As can be seen from the above analysis, different test gases permeate against one material do not share exactly the same characteristics. Furthermore, different materials have different structures. The use of proportion estimations is not scientific.
3. Test
In order to obtain exact difference between estimated data and the collected data, a test subject is specially designed as the following. Labthink barrier laboratory chose Labthink VAC-V1 differential pressure method gas permeability equipment to analyze the gas permeation amount of PC, PET, PVDC, aluminum foil, and other materials. The test gases cover He, N2, Air, O2, CO2. The test temperature set to the room temperature, 35 ℃, 40 ℃, 45 ℃. Some of the data are shown in Table 1.
Table 1 a variety of gases, barrier property collected data table
|
Material/Gas |
25℃ |
35℃ |
40℃ |
45℃ | |
|
PC
125um |
He |
4041.778(26) |
4722.450 |
5065.491 |
|
|
N2 |
90.60(23) |
117.364 |
129.092 |
143.146 | |
|
Air |
175.350(24) |
207.587 |
224.720 |
238.599 | |
|
O2 |
440.535(23) |
571.675 |
608.858 |
659.346 | |
|
CO2 |
2000.655(26) |
2266.981 |
2490.635 |
| |
|
PET
20um |
He |
2237.628(26) |
2667.478 |
2928.106 |
|
|
N2 |
8.244(25.5) |
11.436 |
14.172 |
15.548 | |
|
Air |
18.002(25) |
20.651 |
26.451 |
30.725 | |
|
O2 |
46.423(24) |
72.155 |
81.338 |
91.414 | |
|
CO2 |
289.357(24) |
360.004 |
401.886 |
452.359 | |
|
PVDC
30um |
He |
671.682(27) |
875.907 |
995.698 |
|
|
N2 |
2.665(25) |
4.832 |
5.859 |
7.895 | |
|
Air |
5.046(24) |
10.173 |
12.907 |
17.707 | |
|
O2 |
21.746(25) |
34.971 |
43.985 |
53.203 | |
|
CO2 |
75.455(24) |
172.236 |
230.467 |
306.108 | |
|
AL
100um |
He |
0.116(25) |
0.137 |
0.266 |
|
|
N2 |
0.101(24) |
0.097 |
0.095 |
0.092 | |
|
Air |
0.098(23) |
0.099 |
0.094 |
0.127 | |
|
O2 |
0.095(23) |
0.109 |
0.116 |
0.121 | |
|
CO2 |
0.102(25) |
0.194 |
0.305 |
| |
The regularity of the data table is difficult to spot at a glance. The data have been changed to a ratio relationship table 2 as below. The ratio set the oxygen permeation amount in every material and temperature as standard values (not aluminum foil, because of the test Error, the test data barely change). Taking into account that temperature impact on the barrier property of materials, we calculated the ratio of the gases permeation amount at every temperature against their own permeation amount in 35 ℃, and we got table 3 (Aluminum foil was not considered as the temperature changes barely impact the barrier property of metals).
Table 2 a variety of gases, barrier property data ratio table
|
Material/Gas |
25℃ |
35℃ |
40℃ |
45℃ | |
|
PC
125um |
He |
9.17 |
8.26 |
8.32 |
|
|
N2 |
0.21 |
0.21 |
0.21 |
0.22 | |
|
Air |
0.40 |
0.36 |
0.37 |
0.36 | |
|
O2 |
1 |
1 |
1 |
1 | |
|
CO2 |
4.54 |
3.97 |
4.09 |
| |
|
PET
20um |
He |
48.20 |
36.97 |
36.00 |
|
|
N2 |
0.18 |
0.16 |
0.17 |
0.17 | |
|
Air |
0.39 |
0.29 |
0.33 |
0.34 | |
|
O2 |
1 |
1 |
1 |
1 | |
|
CO2 |
6.23 |
4.99 |
4.94 |
4.95 | |
|
PVDC
30um |
He |
30.89 |
25.05 |
22.64 |
|
|
N2 |
0.12 |
014 |
0.13 |
0.15 | |
|
Air |
0.23 |
0.29 |
0.29 |
0.33 | |
|
O2 |
1 |
1 |
1 |
1 | |
|
CO2 |
3.47 |
4.93 |
5.24 |
5.75 | |
Table 3 a variety of gases, barrier property data temperature comparison table
|
试样/测试气体 |
25℃ |
35℃ |
40℃ |
45℃ | |
|
PC
125um |
He |
0.86 |
1 |
1.07 |
|
|
N2 |
0.77 |
1 |
1.10 |
1.22 | |
|
Air |
0.84 |
1 |
1.08 |
1.15 | |
|
O2 |
0.77 |
1 |
1.07 |
1.15 | |
|
CO2 |
0.88 |
1 |
1.10 |
| |
|
PET
20um |
He |
0.84 |
1 |
1.10 |
|
|
N2 |
0.72 |
1 |
1.24 |
1.36 | |
|
Air |
0.87 |
1 |
1.28 |
1.49 | |
|
O2 |
0.64 |
1 |
1.13 |
1.27 | |
|
CO2 |
0.80 |
1 |
1.12 |
1.26 | |
|
PVDC
30um |
He |
0.77 |
1 |
1.14 |
|
|
N2 |
0.55 |
1 |
1.21 |
1.63 | |
|
Air |
0.50 |
1 |
1.27 |
1.74 | |
|
O2 |
0.62 |
1 |
1.26 |
1.52 | |
|
CO2 |
0.44 |
1 |
1.34 |
1.78 | |
From the data in Table 1, Table 2 and Table 3, when different gases permeate different materials, they share similar characteristics as below.
First of all, one kind of gas does not show the same permeability when it is against different material. Temperature is the most significant factor influencing the permeability. For example, let’s compare the permeation amount of one gas between when it is in 40℃ and when it is at room temperature. When the gas is He, against PC film, GTRHe40/ GTRHe25=1.25, while against PET film, GTRHe40/ GTRHe25=1.31, But for PVDC, GTRHe40/ GTRHe25=1.48. However, if we analyze the data in Table 3, we can see that temperature’s influence on helium permeation is very limited. However, temperature’s impact on nitrogen is very prominent, such as the PC film, GTRN240/ GTRN225=1.42, for PET film, GTRN240/ GTRN225=1.72, as to PVDC, GTRN240/ GTRN225=2.20. Figure 1 is based on Table 3, the nitrogen increase ratio at different temperatures. But pay special attention to the Air and CO2. While they are in the PET and PC, temperature cast very small influence on permeation. But when the two gases permeate through PVDC, temperature influenced a lot. GTRAir40/ GTRAir25=2.56, GTRCO240/ GTRCO225=3.05. Generally speaking, when temperature increases, the permeation amount increase of all kinds of gases against PVDC film is faster than the amount increase speed of PET film and PC film.
First of all, one kind of gas does not show the same permeability when it is against different material. Temperature is the most significant factor influencing the permeability. For example, let’s compare the permeation amount of one gas between when it is in 40℃ and when it is at room temperature. When the gas is He, against PC film, GTRHe40/ GTRHe25=1.25, while against PET film, GTRHe40/ GTRHe25=1.31, But for PVDC, GTRHe40/ GTRHe25=1.48. However, if we analyze the data in Table 3, we can see that temperature’s influence on helium permeation is very limited. However, temperature’s impact on nitrogen is very prominent, such as the PC film, GTRN240/ GTRN225=1.42, for PET film, GTRN240/ GTRN225=1.72, as to PVDC, GTRN240/ GTRN225=2.20. Figure 1 is based on Table 3, the nitrogen increase ratio at different temperatures. But pay special attention to the Air and CO2. While they are in the PET and PC, temperature cast very small influence on permeation. But when the two gases permeate through PVDC, temperature influenced a lot. GTRAir40/ GTRAir25=2.56, GTRCO240/ GTRCO225=3.05. Generally speaking, when temperature increases, the permeation amount increase of all kinds of gases against PVDC film is faster than the amount increase speed of PET film and PC film.
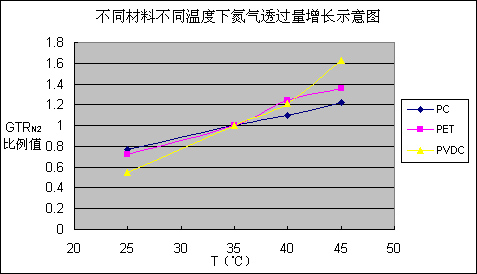
Figure 1 for different materials at different temperatures, nitrogen permeation increase diagram
Second, when different kinds of gases permeate through one material, their permeation amount ratio is different. For example, PC films at room temperature GTRHe∶GTRN2∶GTRAir∶GTRO2∶GTRCO2=9.17∶0.21∶0.40∶1∶4.54, but PET film GTRHe∶GTRN2∶GTRAir∶GTRO2∶GTRCO2=48.20∶0.18∶0.39∶1∶6.23, and PVDC ratio is GTRHe∶GTRN2∶GTRAir∶GTRO2∶GTRCO2=30.89∶0.12∶0.23∶1∶3.47. As this test selected representative materials, the materials do not share much similarity. It can be seen that for the polymer film, it is very difficult to gain a stable gas permeation amount ratio (in this case factors of temperature were not considered). Even when He was excluded (which has the most significant change) and calculate the ratio of other gases, GTRN2∶GTRAir∶GTRO2∶GTRCO2≈0.17∶0.34∶1∶4.75 (average check), there is an arithmetic error up to more than 20%. Furthermore, commonly used estimate ratio may not be from the same literature. It would bring the error to a greater extent.
Third, if temperature factor and gases types are all considered, the regularity of the data is even worse (although for each kind of the gas at each point of temperature, data are regular). For example, PET film at room temperature GTRHe∶GTRN2∶GTRAir∶GTRO2∶GTRCO2=48.20∶0.18∶0.39∶1∶6.23. When 40 ℃, GTRHe∶GTRN2∶GTRAir∶GTRO2∶GTRCO2=36.00∶0.17∶0.33∶1∶4.94. O2 is more temperature sensitive than other gases. But when it comes to PVDC materials at room temperature, GTRHe∶GTRN2∶GTRAir∶GTRO2∶GTRCO2=30.89∶0.12∶0.23∶1∶3.47. When 40 ℃, GTRHe∶GTRN2∶GTRAir∶GTRO2∶GTRCO2=22.64∶0.13∶0.29∶1∶5.24. O2 was not as sensitive as Air and CO2. What is certain is that as the temperature changes, the actual permeation ratio of gases could be more and more different to the average ratio made by calculation.
But for the aluminum foil in the test, different test gases at different temperature are basically consistent. This is a good proof of that temperature changes and the differences of testing gases mainly affect polymer materials.
Fourth, from the data in Table 1, we can see that the gas permeability characteristics significantly affect permeation amount, which proved the above theoretical analysis correct. Let’s look at the molecular weight and dynamics diameter of gases (see Table 4).
Table 4 molecular weight and dynamics diameter of gases
|
Gas Type |
He |
N2 |
Air |
O2 |
CO2 |
|
Molecular Weight |
4 |
28 |
29 |
32 |
44 |
|
Dynamic Diameter/nm |
0.26 |
0.364 |
0.34 |
0.346 |
0.33 |
Table 1 show that N2 has the largest molecular diameter, and He owns the smallest molecule diameter. Thus, as the molecules share similar solubility, the smaller the diameter of gas is, the bigger the permeation amount gets. So for the permeation amount of gases against each material, He has always been the largest, and the N2 is always the smallest. However, someone may ask that, CO2 and O2 dynamics diameters and the proliferation coefficients are similar, then why in table 1 the amount of carbon dioxide permeation is several times of the amount of oxygen? This is because of the solubility coefficient. The polymer does not have functional group to interact with inorganic gas thus critical temperature became the main factor influencing solubility. CO2’s critical temperature is 31 ℃, which is much higher than other common inorganic gas. As a result it owns the biggest solubility coefficient on the material surface and this is the reason why CO2 permeated much more than O2.
4. Summary
Generally speaking, it is impossible to use one estimate ratio relationship and fit it with every material. The type of materials and environment should both be considered. To use oxygen ratio to estimate other gases permeation is thus not recommended. This article only mentioned one-component materials. It could be known that modified materials and composite materials would have been far more complex to gain permeation data.
Title:Non- Oxygen Conventional Gases Permeability Analysis
Link:http://service.labthink.cn/en/article-literature-info-110118134.html
Labthink Copyrights. Please do not copy without permission! Please indicate source when copy.
Link:http://service.labthink.cn/en/article-literature-info-110118134.html
Labthink Copyrights. Please do not copy without permission! Please indicate source when copy.
Member Registration and Login In
| If you are already a member of us, please login in! | If you are not a member of us, please register for free! | ||
·Forget password? |
|
・Terms and Conditions If you have questions, please phone 86-531-85811021 |
|