

Statistical Process of Results and Laboratory Proficiency Evaluation of Proficiency Testing
Source:
Viewer:3234
Issuing Date:2008-05-05
Click to download!
Abstract:This paper introduces the statistical procedures of proficiency testing, calculation methods and details in laboratory proficiency evaluation of plastic packaging material barrier property testing organized by Certification and Accreditation Administration of the People's Republic of China (CNCA).
Keywords:
oxygen transmission rate
, water vapor transmission rate
, proficiency testing
, data statistic
, outlie
In 2007, CNCA organized the nationwide laboratory proficiency testing project, “Barrier Property Test of Plastic Packaging Material――Determination of Oxygen and Water Vapor Transmission Rate”. The result of this project will be issued recently. Labthink, as the only cooperative institute, engaged in the result statistics. This paper introduces the statistical processing method of proficiency testing and laboratory proficiency evaluation of this proficiency testing results in details.
1. Brief Introduction of Data Statistics
The data statistical process of this proficiency testing of plastic packaging material barrier property adopted the result processing method of laboratory proficiency testing program in CNAS-GL02, Guidance on Statistic Treatment of Proficiency Testing Results and Performance Evaluation, and evaluated the proficiency of laboratories taking part in the project by robust statistical method.
The result statistical process of proficiency testing and the method of evaluating the performances are guided by CNAS-GL02, which includes interlaboratory proficiency testing plan as well as verification of the result processing of this plan. Of which, the result statistical process of interlaboratory proficiency testing plan is applicable for most proficiency verification plan. On condition that it is feasible, the result analysis of proficiency testing plan should adopt this procedure as far as possible. When verifying laboratory proficiency based on the result of proficiency testing, we use the words “satisfy/dissatisfy” or “outlier” instead of “passed”. If a result is considered to be outlier, that is to say it is quite statistically different from other results in the group.
2. Introduction of Statistical Method
The premise of statistical analysis is the analysis results obey normal distribution. Normal distribution is the commonest types of statistical distribution. Organizers, especially experts must notice that all the results follow normal distribution approximately. Before statistical analysis, possible measures must been taken to ensure the reasonability and reasonability of collected data. We must inspect data carefully and recognize the gross errors and potential problems through this inspecting process.
2.1Statistic sum up
Normally, seven comprehensive statistic data below must be computed in statistical procedure. It is the premise of laboratory result statistical evaluation.
1. Fruit number, the total of result gained from a specific test, the symbol is N.
2. Median, the intermediate value of a group of data. If N is an odd number, median is a center value, that is, . If N is an even number, median is the
average of two center values, that is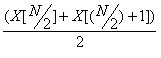 .
.
3. Standard IQR is a measurement of result variability, which equals to IQR multiply 0.7413 (0.7413 is derived from standard normal distribution). The IQR is the difference between the high quartile and the low quartile.
4. Robust CV, is a coefficient of variation,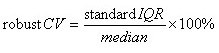 .
.
5. Minimum, the lowest value, 
6. Maximum, the highest value, 
7. Range, the difference between minimum and maximum.
The most important statistical values are median and standard IQR; they are the degree of concentration and distribution of data. Median and standard IQR are robust statistics, they are not influenced by outliers.
2.2 Result of statistical sample pairs
Using Z-score based on robust total statistics (median and standard IQR) to evaluate the result from the participated laboratories. In order to statistic the result of sample pair A and B, we must have two Z-score, the inter-laboratory Z (ZB) and within-laboratory Z (ZW). They are the standard sum (S) and standard difference (D) depending on result pairs.
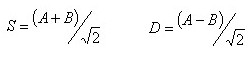 (keep the sign of D)
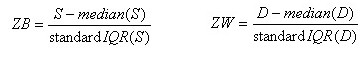
Through the calculation of standard sum (S) and standard difference (D), we can get median and standard IQR of all S and D, then we can compute the ZB and ZW.
2.3 Testing Result Evaluation
Evaluating experimental results by Z-score (ZB and ZW). The absolute value Z is larger than or equals to 3, result or result pair is outlier. 2<|Z|<3, result or result pair is suspiciousness. A positive outlier (ZB≥3) of even pairs and split level pairs indicate that the value of sample pairs is too large. A negative outlier (ZB≤-3) indicates that the value of sample pairs is too small. An outlier (|ZW|≥3) within-laboratory demonstrates that the difference between two results is too large.
Sequence diagram of Z-score is used to explain the statistical condition of results. Z-score of each laboratory is illustrated in orders and the laboratories numbers are marked out in figure, which made it is easy to compare different laboratories. Other methods such as Youden’s figure are also in common use.
Especially, late arrival results and results from supplement testing are not been put in the general statistic but are given result evaluation according to the first-turn general statistic.
3. Proficiency testing and data statistic
The proficiency testing “Barrier property test of plastic packaging material――Determination of oxygen and water vapor transmission rate”, designs samples with “split level” and divides them into two groups, A and B. ZB and ZW are used in data statistic. In the proficiency testing, 69 laboratories took part in oxygen transmission rate testing, 61 of them offered available testing data. 67 laboratories participated water vapor transmission rate testing, 66 of them offered available testing data. On summary of the testing methods, totally 10 laboratories did not use gravimetric method (cup method) in water vapor transmission rate testing, 6 of them using infrared sensor method, 4 of them using electrolysis sensor method. 16 laboratories did not using differential-pressure method in oxygen transmission rate testing, 13 of them using equal-pressure method - oxygen sensor method.
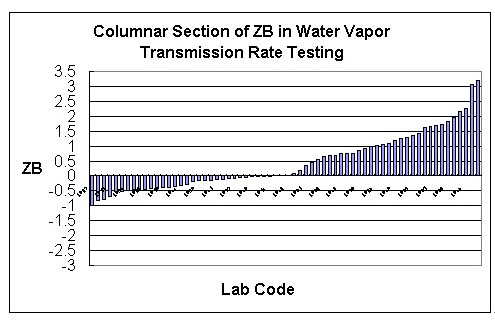
Figure1. Columnar section of ZB in water vapor transmission rate testing
Sequence of Z-score of the first total water vapor transmission rate testing is illustrated in Figure 1, we have a general glance of testing data of laboratories engaged in the project. 2 laboratories that are considered to be outliers did not adopt the recommended method - gravimetric method. We cannot introduce the within-laboratory Z (ZW) of water vapor transmission rate testing and statistic of oxygen transmission rate testing for space restriction.
We can see from the first total statistic of testing data that none of laboratories using gravimetric method and differential-pressure method is considered to be outlier, the systematic error of instruments is within the allowable national range. Statistical data affirmed the basic status of gravimetric method and differential-pressure method.
Title:Statistical Process of Results and Laboratory Proficiency Evaluation of Proficiency Testing
Link:http://service.labthink.cn/en/article-Permeation-info-11011755.html
Labthink Copyrights. Please do not copy without permission! Please indicate source when copy.
Link:http://service.labthink.cn/en/article-Permeation-info-11011755.html
Labthink Copyrights. Please do not copy without permission! Please indicate source when copy.
Member Registration and Login In
| If you are already a member of us, please login in! | If you are not a member of us, please register for free! | ||
·Forget password? |
|
・Terms and Conditions If you have questions, please phone 86-531-85811021 |
|