

Effect of Pressure Difference on Permeability Test for Plastic Film
Source:
Viewer:3218
Issuing Date:2007-09-28
Click to download!
Abstract: this article will explain the relation between differential pressure and barrier properties based on actual testing data.
Keywords:
differential pressure
, barrier property
, permeability
, plastic film
, packaging
Effect of Pressure Difference on Permeability Test for Plastic Film
Yuan Su1, Merken Zhang2, Jiang Zhao2,Ping Yao1,
1. Hunan University of Technology, Zhuzhou 412008, Hunan, <st1:country-region w:st="on">China
2. Labthink Instruments Co. Ltd. Jinan 250031, Shandong, <st1:country-region w:st="on">China
Barrier properties of packaging material play an important role in food and pharmaceutical packaging. Barrier properties include the gas permeation and water vapor permeation. There are different methods to test these properties. The differential pressure method to test gas permeability has the longest history and broadest applications. But there are still doubts for this method, one of which is that the pressure difference between two sides of testing sample may destroy the structure of some fragile material and produce cracks and perforation; also may make the material distortion and become thinner, so the surface of sample will become larger. All these factors will influence the testing results. There has even been far more concerns over these factors when the equal pressure method has been used in <st1:country-region w:st="on">USA. What is the influence on permeability by the pressure difference? Are the data obtained by differential pressure method reliable? These questions are still not verified by experimental data. So we arrange a series of experiments to obtain definite and clarified conclusions.
I Basic Principle
According to the theory of mass transfer [2], the driving force for gas molecules penetrating through a plastic film is chemical potential. When the molecules are absorbed by polymer and then dissolved in it, they will move from a higher chemical potential to a lower one. The chemical potential is determined by chemical activity. The chemical activity is proportional to the concentration of molecules. In gas phases, the concentration Ci can be expressed as partial pressure of molecules pi:
pi = kCi (1)
Where, k is a constant. That means the gas flux will be determined by the partial pressures between the two sides of the sample. If there is a quantity Q of gas that penetrated through an area A in a time t, we have the permeability coefficient P:
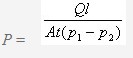 (2)
(2)
Where, p1, p2 are the partial pressures between the two sides of the sample. The partial pressure difference △p=p1- p2. l is the thickness of the film. We can see that the Permeability Coefficient, P, is the quantity of gas passing through a plastic material of the unit thickness, per unit area within per unit time, under unit partial-pressure difference between two sides of the material.
Therefore, the partial pressures between the two sides are needed to determine the permeability. Thus, the earliest and most mature method is partial pressure difference method. There are many test standards in different countries for this method, such as GB/T 1038, ASTM D1434, ISO 2556, ISO 15105-1, JIS K 7126 (method A), etc. All these methods maintain a difference of 1 atmospheric pressure (101.33 kPa) between two sides of the sample and test the permeability under this pressure.
Generally, there are three parameters regarding the permeability of a polymer. Besides the Permeability Coefficient P, there are still two as follows:
1 Transmission Rate, TR: the quantity of gas passing through a plastic material, per unit area per unit time; expressing as (Quantity)/[(Area)(time).
2 Permeance, R, is the quantity of gas passing through a plastic material, per unit area per unit time, under unit partial-pressure difference △p between the two sides of the material; expressing as Q/(A t △p)
There are following relationship for these three parameters:
R=TR/△p, P=R×l (3)
From equation (3), we can see that R and P theoretically should not change with △p. But what is real situation? The following is our arrangement to clarify this question.
II Experiment Arrangement
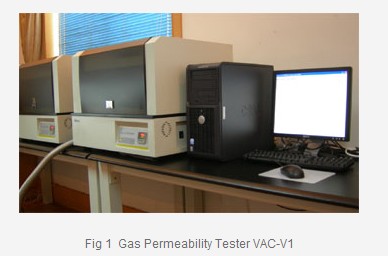
The testing instrument adopts VAC-V1 Gas Permeability Tester made by Labthink Instruments Co., LTD, Jinan, Shandong, <st1:country-region w:st="on">China. This is an instrument based on partial pressure difference. The test range is 0.1~100000 cm3/m2・24h・0.1MPa and can be extended to 600000 cm3/m2・24h・0.1MPa. The vacuum resolution is 0.1Pa, and the vacuum in test cell can be assured below 20 Pa. The temperature can be controlled from ambient temperature up to 50℃; precision of temperature is ±0.2℃. This instrument can measure the Permeance R, Permeability Coefficient P, Diffusion Coefficient D and Solubility Coefficient S. In the standard testing, a perforate paper was used to support the sample and balance the effect of pressure difference.
Besides, the computer system for data treatment, a vacuum pump with a capacity of 0.1Pa and the gas oxygen (99.9%) were used in the experiments. Figure 1 showed the arrangement.
Tests were taken in the standard laboratory. The ambient temperature in the laboratory was 23℃, 50%RH。The test cell was at a temperature of 40℃,the humidity of test gas was 0%RH. The tested materials were 8 types, and were most commonly used in flexible packaging, including: PC (125μm), PC (175μm), PET (12μm), PET (23μm), PET (25μm), PET (70μm), PA (35μm), PE (40μm), CPP (40μm), and OPP (38μm). Besides, there were some multiplayer materials; PE/EVOH/PE (55μm) and PA/PE (80μm) were used. The permeance range of samples was 1.49 cm3/m2・24h・0.1MPa to 7030 cm3/ m2・24h・0.1MPa. Each sample was tested under a series of partial pressure difference of: 30kPa, 50 kPa, 70 kPa, 90 kPa, 110 kPa, 130 kPa and 150 kPa. At each of these pressure differences, each of the sample is tested at least three times.
Ⅲ. The Analysis of Testing Data
Table 1 below gives the data of Transmission Rate TR for different materials at different partial pressure difference; table 2, of Permeance R; and table 3, of Permeability Coefficient P.
Table 3 Permeability coefficient P [(E-11) cm3・cm/cm2・s・cmHg] for different materials with different partial pressure difference
|
Materials (Thickness at μm) |
Partial Pressure Difference (kPa) | ||||||
|
30 |
50 |
70 |
90 |
110 |
130 |
150 | |
|
PE (40) |
38.1 |
38.4 |
38.2 |
41.1 |
40.0 |
41.1 |
40.3 |
|
CPP (40) |
20.8 |
21.2 |
20.6 |
20.2 |
19.8 |
20.8 |
20.9 |
|
OPP (38) |
10.3 |
10.5 |
11.0 |
10.8 |
10.6 |
10.4 |
10.6 |
|
PC (125) |
11.2 |
11.4 |
11.3 |
11.2 |
11.5 |
11.5 |
11.6 |
|
PC (175) |
11.0 |
11.5 |
11.7 |
11.8 |
11.9 |
12.0 |
11.8 |
|
PET (12) |
0.260 |
0.252 |
0.250 |
0.249 |
0.262 |
0.267 |
0.266 |
|
PET (23) |
0.264 |
0.273 |
0.264 |
0.263 |
0.262 |
0.263 |
0.261 |
|
PET (25) |
0.259 |
0.258 |
0.257 |
0.256 |
0.256 |
0.266 |
0.261 |
|
PET (70) |
0.30 |
0.28 |
0.278 |
0.280 |
0.287 |
0.281 |
0.279 |
|
PA (35) |
0.180 |
0.172 |
0.171 |
0.167 |
0.158 |
0.164 |
0.164 |
|
PE-EVOH-PE (55) |
|
0.0215 |
0.0174 |
0.0163 |
0.0137 |
0.0132 |
0.0145 |
|
PA-PE (80) |
1.15 |
1.15 |
1.12 |
1.17 |
1.19 |
1.22 |
1.24 |
The relationship of table 1, 2 and 3 are described in figures 2, 3 and 4 respectively. The interesting phenomena from these tables and figures are as follows: The transmission rate (TR) increased proportionally with partial pressure difference; but the permeance R and permeability coefficient P do not change with partial pressure difference.
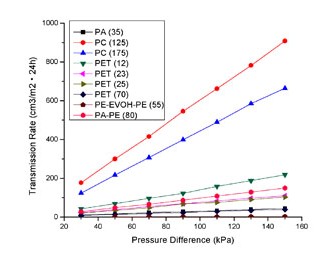
Fig 2 TR As A Function Of Pressure Difference
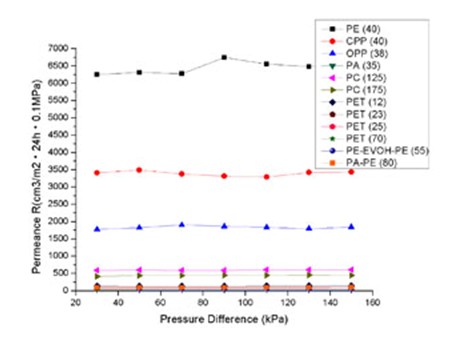
Fig 3 Relationship Between Permeacen And Pressure Difference
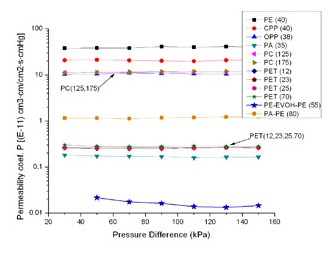
Fig 4 Relationship Between Permeability Coef And Pressure Difference
Note: In figure 2, only illustrates the materials with good and moderate barrier properties. Low barrier property materials, PE (40), CPP (40) and OPP (38) are not marked in the drawing. However, a proportionate increase can be found in Fig 1.
From the basic principle in the section I of this article, the transmission rate (TR) is the quantity of gas passing through a plastic material, per unit area and per unit time. This variable normally was determined by two factors:
1)the proper permeability of the material;
2)the difference of concentration between two sides of the material.
If the proper permeability of material is not changed, the greater the difference of concentration, the easier the transmission of gas. That means the TR will increase with the partial pressure difference from equation (1). This was one of the results certified by our experiments. But if we only concern the permeability of material, we should eliminate this external factor, that is, eliminate the partial pressure difference. And so, we have the R in equation (3). The experimental data has shown that R (and so P) does not change with partial pressure difference. As in a circuit, the greater the difference of electrical potential between the two points of a resistance, the greater current passes through this resistance. But the resistance does not change with the difference of electrical potential.
Moreover, the same material with different thickness would produce different permeability. But it can not be the conclusion that the thinner material has a greater capacity of permeation than the thicker. Because for the same material, it should have the same permeability for the same type of gas. So, we normalize the R by multiplying it with the thickness l as in the equation (3), and then, we have the permeability coefficient P. From PC (125) and PC (175) in Table 2 and
Table 3, we can see R (125) is greater than R (175), but P (125) is the same as P (175). There are same results for PET (12), PET (23), PET (25) and PET (70) (see figure 3 and figure 4). It is clear that the same material have the same permeability coefficient for the same type of gas, even if its R will change with its thickness. Generally, the permeability coefficient is a basic value for the permeability of material.
IV Conclusion
The method of partial pressure difference has taken an efficient solution for the effect of pressure difference, and can assure that the structure of samples has no significant deformation under the pressure difference. In our testing range, that is, in the range of partial pressure difference method, the tested data conforms to theoretical prediction; R and P do not change with pressure difference between two sides of the material. The test results were stable and reproducible.
Reference:
[1] Liao Qizhong, Permeation and Leakage of Packages, Plastics Packaging [J Chinese], 2002, 1(32)
[2] R.J. Hernandez, et al, Plastics Packaging[M], HANSER, 2000
Title:Effect of Pressure Difference on Permeability Test for Plastic Film
Link:http://service.labthink.cn/en/article-Permeation-info-11011796.html
Labthink Copyrights. Please do not copy without permission! Please indicate source when copy.
Link:http://service.labthink.cn/en/article-Permeation-info-11011796.html
Labthink Copyrights. Please do not copy without permission! Please indicate source when copy.
Relating Articles
- Verification Tests for Barrier Property of Starch-based Biodegradable Packaging
- Analysis on Purchasing Choice of High Barrier Property Material Testing Instruments
- Suggestions for Barrier Property Testing of High Transmission Rate Materials
- The Analysis on Infusion Bag Testing Requirements and Introduction to Relevant Testing Methods
- Present Situation and Trend of Permeation Testing
Member Registration and Login In
| If you are already a member of us, please login in! | If you are not a member of us, please register for free! | ||
·Forget password? |
|
・Terms and Conditions If you have questions, please phone 86-531-85811021 |
|